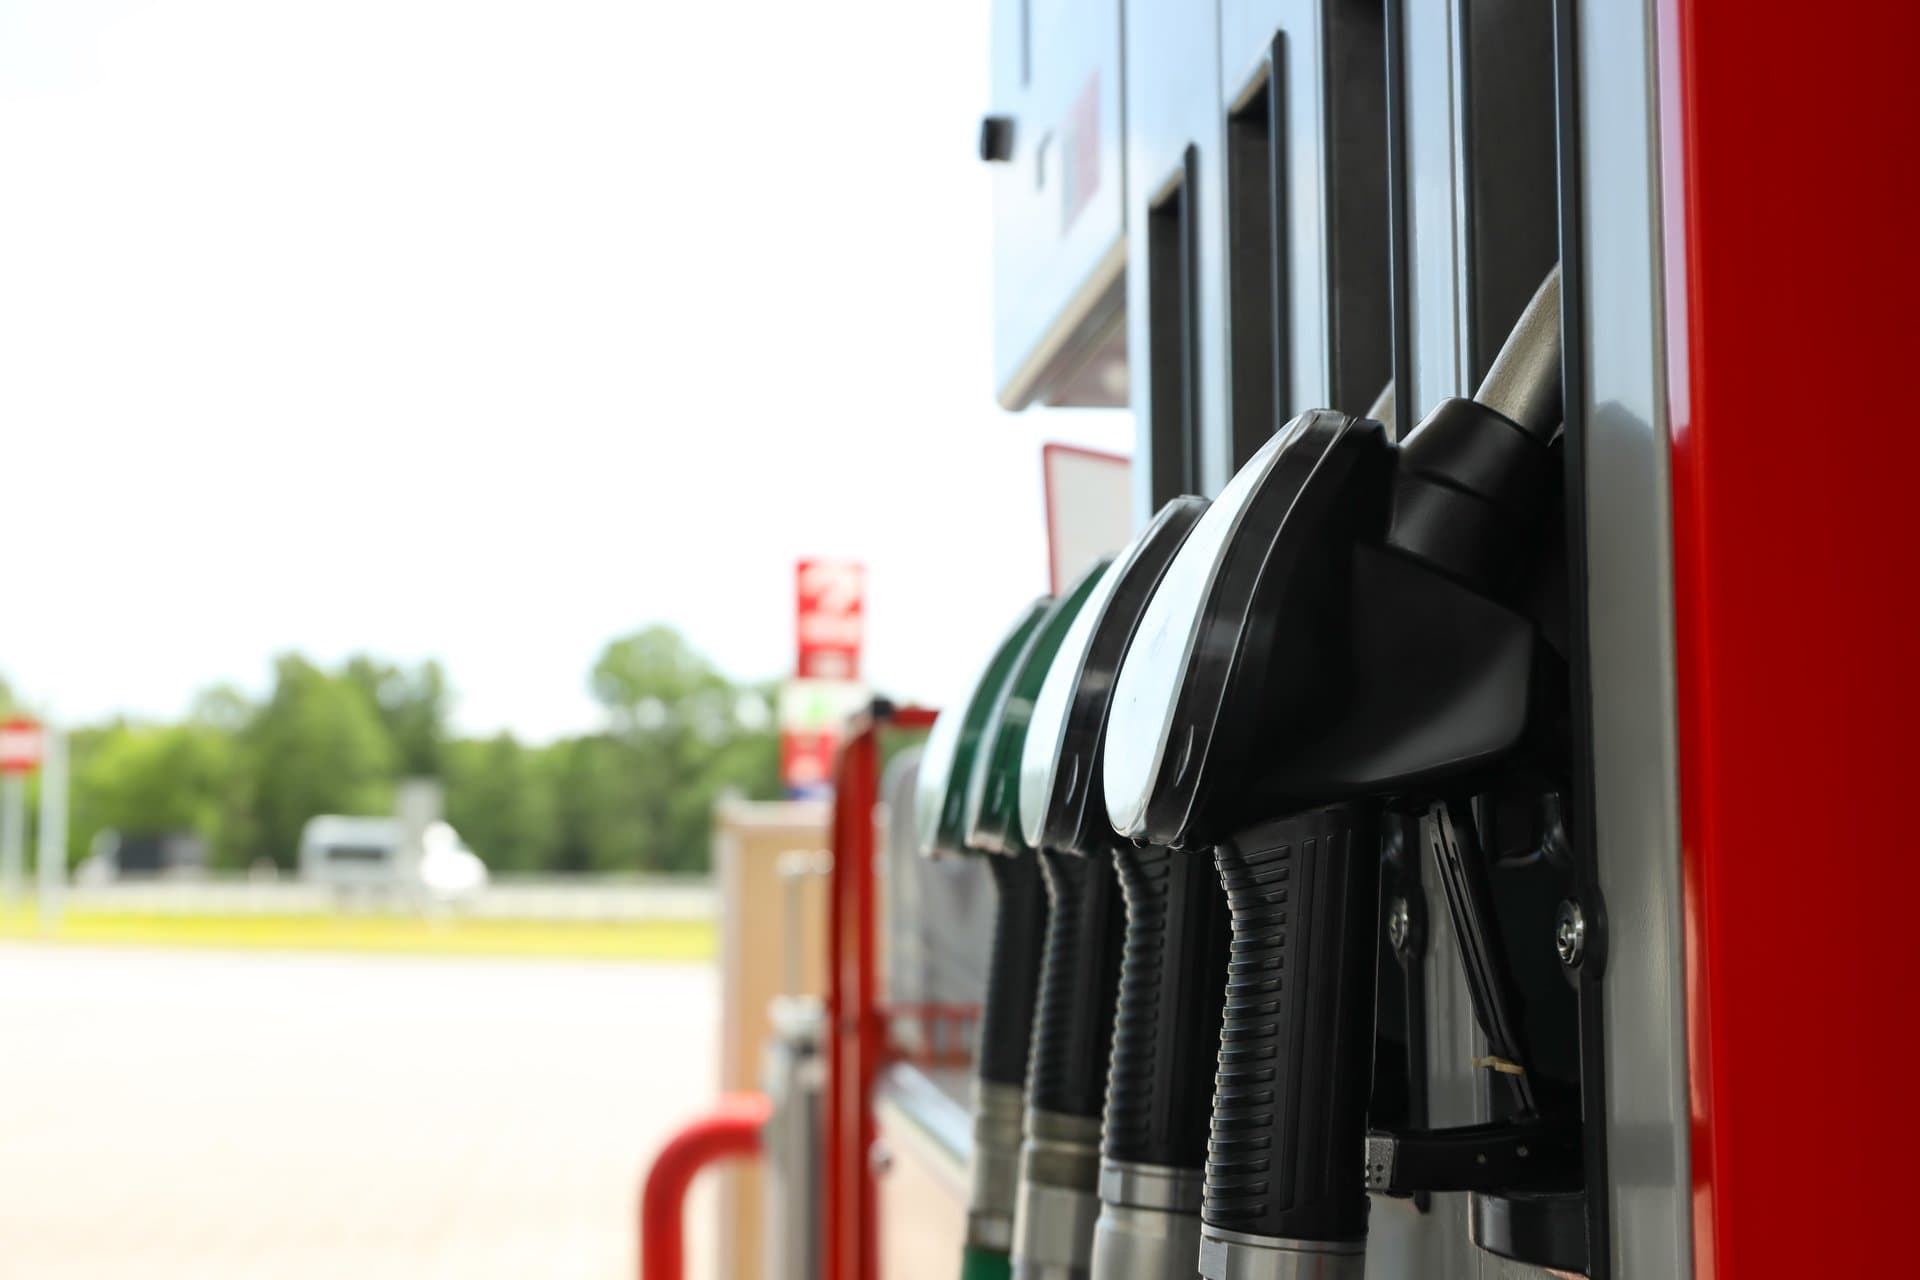
Two months of falling gas prices just hit a speed bump. If you built your Q3 budget on May's pain and June's relief, it's time to check the math again.
The national average for regular gasoline climbed to $3.987 a gallon for the week ending July 13, up 7.6 cents from the prior week, according to EIA weekly data. That's the first weekly increase after gas fell from a May peak of $4.605 a gallon — a drop that had given DSP operators real breathing room on fuel line items. The relief wasn't permanent, and last week's uptick shows it.
For context, $3.987 a gallon still sits above the 75th percentile of the last five years of EIA readings, meaning even after the spring pullback, fuel costs remain elevated versus historical norms. Operators running a mixed fleet of Ram ProMaster 2500s and Ford Transit 350s — both gasoline vehicles averaging 18-19 mpg — feel every cent of that swing directly, since neither vehicle has a diesel hedge to fall back on.
Do the arithmetic on a typical DSP route: a van running 150 miles a day at 18 mpg burns roughly 8.3 gallons. At $3.987/gallon, that's $33 a day in fuel per van versus $31 a day just a week earlier — a small gap that compounds fast across a 20-van fleet running six days a week. Over a month, that single week's price swing adds up to real money that either comes out of margin or has to be recovered somewhere else.
The trend line matters more than any single week. If gas keeps climbing back toward June's $4.05-4.28 range, operators who assumed the worst was behind them in May will need to revisit their per-route economics before the next planning cycle, not after.
See how this affects your cost per stop — free calculator at pexara.ai/calculator.